INTRODUCTION
Lung cancer is the second most frequent cancer, accounting for 1.8 million deaths worldwide in 20201. Histologically, most (>80%) lung cancers are non-small cell lung cancers (NSCLC), comprising non-squamous and squamous cell carcinomas2,3. Patients with NSCLC are commonly diagnosed with advanced or metastatic disease (mNSCLC; stages IIIB–IV)4, with a 5-year overall survival rate ranging from 0–26%5.
The systemic treatment of mNSCLC has traditionally been based on platinum-based chemotherapy regimens6; however, these regimens have reached a plateau in overall response rates (ORRs: 25–35%) and overall survival (OS: 10–15% at two years) in fit patients7. Over the past decade, however, advancements in tumor biology have resulted in the identification of genetic alterations (biomarkers) and the subsequent development of specific therapies. Biomarkers of particular interest include the epidermal growth factor receptor (EGFR), the anaplastic lymphoma kinase (ALK), and the programmed death-ligand 1 (PD-L1)3,8. The European Society for Medical Oncology (ESMO)8 and the National Comprehensive Cancer Network (NCCN)3 have incorporated molecular testing in the patient’s diagnostic work-up before treatment initiation. Beyond chemotherapy, systemic treatments for mNSCLC include tyrosine kinase inhibitors (TKIs), immune-oncology (IO) therapies, and vascular endothelial growth factor (VEGF) inhibitors9. Currently, the IO therapies recommended as monotherapy or combination therapy in mNSCLC include the anti-programmed death (PD)-1 antibodies pembrolizumab10, nivolumab11, and cemiplimab12, and the anti-PD-L1 antibodies, atezolizumab13 and durvalumab14. Based on the current NCCN and ESMO guidelines for mNSCLC, these IO therapies can be offered to patients depending on their Eastern Cooperative Oncology Group performance status (ECOG PS), the presence or absence of EGFR/ALK aberrations, and the PD-L1 expression levels3,8. Each IO agent has a companion diagnostic assay for evaluating PD-L1 expression levels15,16.
Currently, real-world data on PD-L1 testing in patients with mNSCLC and the selection of appropriate IO therapies are limited, especially for European countries. We assessed the utilization of PD-L1 testing and PD-1/PD-L1 inhibitor treatment patterns and clinical outcomes in the mNSCLC setting after pembrolizumab reimbursement in Greece.
METHODS
Design and patients
This non-interventional, retrospective chart review study utilized the data from patients with mNSCLC from the electronic, web-based lung cancer registry (LCR) from the Sotiria Hospital. The observation period lasted four years, comprising a 3-year patient enrollment period (15 August 2016 to 14 August 2019) and one year of additional follow-up (15 August 2019 to 14 August 2020) (Supplementary file Figure S1); thus, patients could be followed-up for ≥1–4 years.
Included were adult patients with a histologically or cytologically confirmed diagnosis of stage IIIB/IIIC/IV NSCLC who initiated treatment for their disease during the enrollment period. Patients who received first line (L) treatment within a clinical trial or those with stage III NSCLC who were eligible for definitive treatment were excluded. The study was approved by the hospital’s Independent Review Board/Independent Ethics Committee. All included patients provided informed consent.
Study endpoints
The study primarily assessed the rate of PD-L1 testing during the observation period and described the 1L, 2L, and 3L regimen(s) that were prescribed by EGFR/ALK status and PD-L1 tumor proportion score (TPS). Systemic treatment for mNSCLC was categorized into: 1) PD-1/PD-L1-based therapies; 2) single-agent TKIs; 3) VEGF inhibitor-containing regimens; 4) platinum-based chemotherapy combinations; and 5) all other regimens. Regimen classes were exclusive, and patients were classified hierarchically in the above-shown order. During the observation period, the PD-1/PD-L1 inhibitors reimbursed in the 1L treatment of patients with mNSCLC and PD-L1 TPS ≥50% were single-agent pembrolizumab and single-agent atezolizumab (albeit through a special procedure)17. Over the same period, chemotherapy combinations with pembrolizumab or atezolizumab, or nivolumab plus ipilimumab were approved in the 1L treatment of patients with mNSCLC regardless of PD-L1 expression levels. Approved 2L monotherapies were nivolumab, pembrolizumab, and atezolizumab17.
Other study endpoints included the proportion of patients with varying PD-L1 expression levels among those tested for PD-L1, overall and by line of therapy; the factors associated with PD-L1 test ordering; the patients’ OS, progression-free survival (PFS), and ORR by line of treatment, regimen class received, and EGFR/ALK status; and the utilization of pembrolizumab by line of treatment. OS was defined as the time from first treatment dose to death from any cause or censoring, measured on the last follow-up date. PFS was defined as the time from first treatment dose to documented clinical progression or death from any cause, whichever occurred first. Patients without documented clinical progression or death were censored for PFS on the last follow-up date. ORR was defined as the proportion of patients who had radiologically documented or clinically assessed complete response (CR) or partial response (PR).
Sample size and statistical measures
Due to the study design, no formal sample size calculation was conducted. Patient data were analyzed using descriptive statistics. Time-to-event outcomes (OS, PFS), overall or by treatment class, were evaluated by Kaplan-Meier analyses. Kaplan-Meier analyses by treatment class were performed only for classes with >20 patients; all other classes were analyzed under the ‘other’ category. Analyses were performed using SAS (v9.4 SAS Institute, Cary, NC).
RESULTS
Patient disposition and baseline characteristics
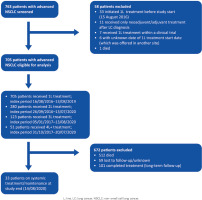
In total, 763 patients with mNSCLC were identified in the Sotiria LCR, of whom 705 patients were eligible for analysis (Figure 1). At the end of follow-up, 512 (72.6%) patients had died, 59 (8.4%) were lost to follow-up, 101 (14.3%) had completed treatment and were on long-term follow-up, and 33 (4.7%) were on systemic or maintenance antitumor therapy.
The patient characteristics at 1L, overall and by year of treatment initiation, were generally similar (Table 1). The EGFR and ALK biomarkers were tested for 286 (40.6%) and 238 (33.8%) patients, respectively; the majority (>90.0%) of EGFR and ALK tested patients were mutation- or translocation-negative.
Table 1
Demographic and clinical characteristics of patients with advanced NSCLC at 1L treatment initiation, overall and by year of treatment initiation
| Characteristics | Overall (N=705) n (%) | Year of 1L treatment initiation | |||
|---|---|---|---|---|---|
| 2016 (N=80) n (%) | 2017 (N=221) n (%) | 2018 (N=255) n (%) | 2019 (N=149) n (%) | ||
| Age (years) | |||||
| Median (IQR) | 68.7 (62.3–74.5) | 68.5 (62.7–72.6) | 68.5 (61.5–74.5) | 69.3 (62.6–74.5) | 68.2 (62.6–74.8) |
| ≤65 | 234 (33.2) | 25 (31.3) | 74 (33.5) | 82 (32.2) | 53 (35.6) |
| >65 | 471 (66.8) | 55 (68.8) | 147 (66.5) | 173 (67.8) | 96 (64.4) |
| Male | 556 (78.9) | 62 (77.5) | 181 (81.9) | 196 (76.9) | 117 (78.5) |
| Smoking status | |||||
| Former or current | 634 (89.9) | 74 (92.5) | 202 (91.4) | 228 (89.4) | 130 (87.3) |
| Current | 407 (57.7) | 49 (61.3) | 118 (53.4) | 156 (61.2) | 84 56.4 |
| Former | 227 (32.2) | 25 (31.3) | 84 (38.0) | 72 (28.2) | 46 30.9 |
| Never | 31 (4.4) | 3 (3.8) | 11 (5.0) | 11 (4.3) | 6 (4.0) |
| Unknown | 40 (5.7) | 3 (3.8) | 8 (3.6) | 16 (6.3) | 13 (8.7) |
| ECOG performance status | |||||
| 0−1 | 449 (63.7) | 46 (57.5) | 140 (63.4) | 163 (63.9) | 100 (67.1) |
| ≥2 | 192 (27.2) | 22 (27.5) | 56 (25.3) | 70 (27.5) | 44 (29.5) |
| Unknown | 64 (9.1) | 12 (15.0) | 25 (11.3) | 22 (8.6) | 5 (3.4) |
| Tumor stage | |||||
| IIB/IIIC | 192 (27.2) | 24 (30.0) | 63 (28.5) | 62 (24.3) | 43 (28.9) |
| IV | 513 (72.8) | 56 (70.0) | 158 (71.5) | 193 (75.7) | 106 (71.1) |
| Histology | |||||
| Non-squamous | 476 (67.5) | 53 (66.3) | 143 (64.7) | 174 (68.2) | 106 (71.1) |
| Squamous | 229 (32.5) | 27 (33.8) | 78 (35.3) | 81 (31.8) | 43 (28.9) |
| Brain metastases | 80 (11.4) | 4 (5.0) | 33 (14.9) | 31 (12.2) | 12 (8.1) |
| EGFR mutation status | |||||
| EGFR tested | 286 (40.6) | 32 (40.0) | 68 (30.8) | 127 (49.8) | 59 (39.6) |
| Positive (SQI)a | 27 (9.4) | 2 (6.3) | 8 (11.8) | 12 (9.5) | 5 (8.5) |
| Negativea | 259 (90.6) | 30 (93.8) | 60 (88.2) | 115 (90.6) | 54 (91.5) |
| Unknown | 419 (59.4) | 48 (60.0) | 153 (69.2) | 128 (50.2) | 90 (60.4) |
| ALK translocation status | |||||
| ALK tested | 238 (33.8) | 22 (27.5) | 58 (26.2) | 101 (39.6) | 57 (38.3) |
| Positivea | 16 (6.7) | 1 (4.6) | 1 (1.7) | 7 (6.9) | 7 (12.3) |
| Negativea | 222 (93.3) | 21 (95.5) | 57 (98.3) | 94 (93.1) | 50 (87.7) |
| Unknown | 467 (66.2) | 58 (72.5) | 163 (73.8) | 154 (60.4) | 92 (61.8) |
| ROS-1 status | |||||
| Rearrangement not present | 25 (3.6) | 1 (0.5) | 13 (5.1) | 11 (7.4) | |
| Unknown | 680 (96.5) | 80 (100) | 220 (99.6) | 242 (94.9) | 138 (92.6) |
| PD-L1 expression status | |||||
| PD-L1 tested | 240 (34.0) | 1 (1.3) | 36 (16.3) | 109 (42.7) | 94 (63.1) |
| TPS <1%a | 99 (41.3) | - | 13 (36.1) | 40 (36.7) | 46 (48.9) |
| TPS 1−49%a | 78 (32.5) | 1 (100) | 9 (25.0) | 36 (33.0) | 32 (34.0) |
| TPS ≥50%a | 58 (24.2) | - | 11 (30.6) | 31 (38.4) | 16 (17.0) |
| Unknowna | 5 (2.1) | - | 3 (8.3) | 2 (1.8) | - |
| Type of PD-L1 assay | |||||
| DAKO 22C3 | 216 (30.6) | - | 30 (13.6) | 101 (39.6) | 85 (57.1) |
| VENTANA SP263 | 9 (1.3) | 1 (1.3) | - | 2 (0.8) | 6 (4.0) |
| Unknown | 15 (2.1) | - | 6 (2.7) | 6 (2.4) | 3 (2.0) |
| EGFR and ALK statusb | |||||
| Negative or unknown | 662 (93.9) | 77 (96.3) | 212 (95.9) | 236 (92.6) | 137 (92.0) |
| Positive | 43 (6.1) | 3 (3.8) | 9 (4.1) | 19 (7.5) | 12 (8.1) |
ALK: anaplastic lymphoma kinase. ECOG: Eastern Cooperative Oncology Group. EGFR: epidermal growth factor receptor. L: line of treatment. NSCLC: non-small cell lung cancer. PD-L1: programmed death ligand 1. IQR: interquartile range. SQI: semi-quantitative index. TKI: tyrosine kinase inhibitor. TN:, tumor, node, metastases. TPS: tumor proportion score. VEGF: vascular endothelial growth factor. EGFR, ALK, and PD-L1 tests were conducted prior to the date of 1L initiation or within 30 days after 1L initiation.
PD-L1 test rates and factors associated with PD-L1 testing
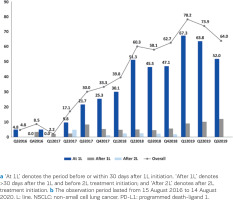
Of all patients, 304 (43.1%) were tested for PD-L1 expression at any time during follow-up. The testing rates increased from 4.8% in quarter Q3 of 2016 to 64.0% in Q3 of 2019 (Figure 2); the average testing rate over Q1–Q3 of 2019 was 73.8%. Across the observation period, 79.0% (240/304) of tested patients were tested at 1L (i.e. before or within 30 days after 1L initiation); the proportions of patients tested after the 1L (i.e. >30 days after 1L and before 2L treatment initiation) or after the 2L treatment initiation were 13.5% (41/304) and 4.0% (12/304), respectively. Most patients (272/304; 89.5%) were tested for PD-L1 expression with the DAKO 22C3 test, as this was the only test available in the hospital during the observation period. Of all patients tested for PD-L1 expression at any time, 39.8% (121/304), 34.9% (106/304), and 23.4% (71/304) had TPS <1%, 1–49%, or ≥50%, respectively. The corresponding rates at 1L only were 41.3% (99/240), 32.5% (78/240), 24.2% (58/240), and 2.1% (5/240).
Figure 2
PD-L1 testing rates overall and at/after 1L and after 2L of treatment for patients with advanced NSCLC during the observation perioda,b
Significant differences between tested and untested patients for PD-L1 expression at 1L were observed in median age (68 versus 70 years, respectively; p=0.017), ECOG PS ≤1 versus ≥2 (70.0% versus 60.4%, respectively; p=0.033), non-squamous versus squamous histology (72.9% versus 64.7%, respectively; p=0.028) and stage IV versus IIIB/C stages (77.5% versus 70.3%; p=0.043) (Supplementary file Table S1).
Treatment by EFGR/ALK status and PD-L1 expression
At 1L, most (66.3%) patients with EGFR/ALK negative or unknown status, and PD-L1 TPS <50%, received platinum-based chemotherapy, while most (59.3%) patients with PD-L1 TPS ≥50% received PD-1/PD-L1 inhibitors (Table 2). Regardless of PD-L1 expression levels, a total of 20.6% of PD-L1 tested patients received PD-1/PD-L1 inhibitors; most frequent treatment was pembrolizumab, which was given to 50.0% and 90.6% of patients with PD-L1 TPS <50% and ≥50%, respectively. At the 2L, regardless of PD-L1 expression levels, 64.5% of PD-L1 tested patients received PD-1/PD-L1 inhibitors. Most frequently, patients with TPS <1% received nivolumab (92.3%), and patients with TPS ≥1% pembrolizumab (55.9%). Lastly, most patients received other therapies at the 3L, irrespective of PD-L1 expression level.
Table 2
1L, 2L, and 3L treatments in patients with EGFR/ALK negative or unknown status at 1L and 2L, overall and by PD-L1 expression
| Treatment | Overall n (%) | Untested for PD-L1 n (%) | PD-L1 TPS <50% n (%) | PD-L1 TPS ≥50% n (%) |
|---|---|---|---|---|
| 1L, N | 662 | 448 | 160 | 54 |
| Platinum-based chemotherapy | 409 (61.8) | 289 (64.5) | 106 (66.3) | 14 (25.9) |
| PD-1/PD-L1-based therapies | 65 (9.8) | 21 (4.7) | 12 (7.5) | 32 (59.3) |
| Pembrolizumaba | 35 (53.9) | - | 6 (50.0) | 29 (90.6) |
| Nivolumaba,b | 25 (38.5) | 20 (95.2) | 3 (25.0) | 2 (6.3) |
| Othera | 5 (7.7) | 1 (4.8) | 3 (25.0) | 1 (3.1) |
| Anti-VEGF-based therapies | 61 (9.2) | 32 (7.1) | 26 (16.3) | 3 (5.6) |
| TKI | 6 (0.9) | 5 (1.1) | 1 (0.6) | - |
| Other | 121 (18.3) | 101 (22.5) | 15 (9.4) | 5 (9.3) |
| Overall | Untested for PD-L1 | PD-L1 TPS <1% | PD-L1 TPS ≥1% | |
| 2L, N | 260 | 167 | 35 | 58 |
| PD-1/PD-L1-based therapies | 139 (53.5) | 79 (47.3) | 26 (74.3) | 34 (58.6) |
| Pembrolizumaba | 26 (18.7) | 7 (8.9) | - | 19 (55.9) |
| Nivolumaba | 108 (77.7) | 71 (89.9) | 24 (92.3) | 13 (38.2) |
| Othera | 5 (3.6) | 1 (1.3) | 2 (7.7) | 2 (5.9) |
| Platinum-based chemotherapy | 26 (10.0) | 13 (7.8) | 2 (5.7) | 11 (19.0) |
| Anti-VEGF-based therapies | 1 (0.4) | - | - | 1 (1.7) |
| TKI | 6 (2.3) | 5 (3.0) | 1 (2.9) | - |
| Clinical trial | 3 (1.2) | 3 (1.8) | - | - |
| Other | 85 (32.7) | 67 (40.1) | 6 (17.1) | 12 (20.7) |
| 3L, N | 113 | 76 | 15 | 22 |
| Platinum-based chemotherapy | 12 (10.6) | 7 (9.2) | 1 (6.7) | 4 (18.2) |
| PD-1/PD-L1-based therapies | 18 (15.9) | 16 (21.1) | 1 (6.7) | 1 (4.6) |
| Anti-VEGF-based therapies | 1 (0.9) | - | - | 1 (4.6) |
| TKI | 3 (2.7) | 3 (4.0) | - | - |
| Clinical trial | 1 (0.9) | - | 1 (6.7) | - |
| Other | 78 (69.0) | 50 (65.8) | 12 (80.0) | 16 (72.7) |
ALK: anaplastic lymphoma kinase. EGFR: epidermal growth factor receptor. L: line of treatment. NSCLC: non-small cell lung cancer. PD-1, programmed death 1. PD-L1: programmed death ligand 1. TKI: tyrosine kinase inhibitor. TPS: tumor proportion score. VEGF: vascular endothelial growth factor. EGFR, ALK, and PD-L1 tests were conducted before the date of 1L initiation or within 30 days after 1L initiation.
Most patients testing positive for EGFR/ALK received TKI treatment at 1L (79.1%) or 2L (45.0%).
Time-to-event and overall response rate analyses
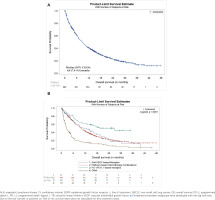
At 1L, the median (95% confidence interval [CI]) OS for patients testing EGFR/ALK negative or unknown was 8.8 (7.4−9.9) months (Figure 3A); the highest median (95% CI) OS was attained with PD-1/PD-L1-based therapies (26.7 [10.6−not reached] months) followed by platinum-based chemotherapy combinations (10.3 [8.8−11.4] months; Figure 3B). The median (95% CI) OS for patients testing EGFR/ALK positive was 17.7 (7.4−21.4) months. At 2L, the median (95% CI) OS for patients testing EGFR/ALK negative or unknown was 7.5 (6.3–8.9) months.
Figure 3
Kaplan-Meier estimates of overall survival for patients with NSCLC and EGFR/ALK negative or unknown status at 1L treatment; A) overall; and B) by treatment classa
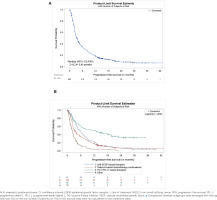
At 1L, the median (95% CI) PFS for patients testing EGFR/ALK negative or unknown was 3.4 (2.8−3.8) months (Figure 4A); the highest median (95% CI) PFS was attained with PD-1/PD-L1-based therapies (12.0 [5.6−19.8] months) followed by platinum-based chemotherapy combinations (3.3 [2.8−3.9] months; Figure 4B). The overall median (95% CI) PFS for patients testing EGFR/ALK positive was 5.3 (3.4−9.4). At 2L, the overall median (95% CI) PFS for patients who were EGFR/ALK negative or unknown was 2.7 (2.5–3.0).
Figure 4
Kaplan-Meier estimates of progression-free survival for patients with NSCLC and EGFR/ALK negative or unknown status at 1L treatment; A) overall; B) by treatment classa
At 1L, ORR was achieved by 23.4% of patients with EGFR/ALK negative or unknown and 34.9% of patients with EGFR/ALK positive (Table 3); the corresponding 2L rates were 11.2% and 10.0%.
Table 3
Overall response rates by type of 1L regimen for patients with advanced NSCLC by EGFR/ALK status
| Overall n (%) | Anti-VEGF-based therapies n (%) | Platinum-based chemotherapy n (%) | PD-1/PD-L1-based therapies n (%) | TKIs n (%) | Other n (%) | |
|---|---|---|---|---|---|---|
| EGFR/ALK negative or unknown status | ||||||
| Total | 662 | 61 | 409 | 65 | 6 | 121 |
| Best response | ||||||
| Complete response | 4 (0.6) | - | 3 (0.7) | 1 (1.5) | - | - |
| Partial response | 151 (22.8) | 27 (44.3) | 98 (24.0) | 22 (33.8) | - | 4 (3.3) |
| Stable disease | 178 (26.9) | 21 (34.4) | 117 (28.6) | 19 (29.2) | - | 21 (17.4) |
| Progressive disease | 138 (20.8) | 4 (6.6) | 92 (22.5) | 11 (16.9) | 1 (16.7) | 30 (24.8) |
| Non-evaluable | 191 (28.9) | 9 (14.8) | 99 (24.2) | 12 (18.5) | 5 (83.3) | 66 (54.5) |
| Objective response ratea | ||||||
| Yes | 155 (23.4) | 27 (44.3) | 101 (24.7) | 23 (35.4) | - | 4 (3.3) |
| No | 507 (76.6) | 34 (55.7) | 308 (75.3) | 42 (64.6) | 6 (100) | 117 (96.7) |
| EGFR/ALK positive status | ||||||
| Total | 43 | 2 | 6 | 1 | 34 | - |
| Best response | ||||||
| Complete response | - | - | - | - | - | - |
| Partial response | 15 (34.9) | 1 (50.0) | 2 (33.3) | - | 12 (35.3) | - |
| Stable disease | 9 (20.9) | - | 3 (50.0) | - | 6 (17.6) | - |
| Progressive disease | 8 (18.6) | 1 (50.0) | - | - | 7 (20.6) | - |
| Non-evaluable | 11 (25.6) | - | 1 (16.7) | 1 (100) | 9 (26.5) | - |
| Objective response ratea | ||||||
| Yes | 15 (34.9) | 1 (50.0) | 2 (33.3) | - | 12 (35.3) | - |
| No | 28 (65.1) | 1 (50.0) | 4 (66.7) | 1 (100) | 22 (64.7) | - |
ALK: anaplastic lymphoma kinase. EGFR: epidermal growth factor receptor. L: line of treatment. NSCLC: non-small cell lung cancer. PD-1, programmed death 1. PD-L1: programmed death ligand 1. TKI: tyrosine kinase inhibitor. VEGF: vascular endothelial growth factor. EGFR and ALK tests were conducted prior to the date of 1L initiation or within 30 days after 1L initiation.
Utilization patterns of pembrolizumab by line of therapy
Sixty-nine patients with EGFR/ALK negative or unknown status received pembrolizumab across the study period (Supplementary file Table S2). Most patients were former or current smokers (89.9%), with an ECOG PS ≤1 (75.4%), and had stage IV disease (79.7%), and non-squamous histology (72.5%). By the end of follow-up, 14.5% (10/69) patients were continuing with pembrolizumab (1L: 15.8% [6/38]; 2L: 14.3% [4/28]) and 85.5% (59/69) discontinued treatment (1L: 84.2% [32/38]; 2L: 86.2% [25/29]; 3L: 100% [2/2]).
The main discontinuation reason was disease progression (1L: 37.5% [12/32]; 2L: 40.0% [10/25]). Pembrolizumab-treated patients were followed up for a median (range) of 14.9 (0.8–34.6) and 8.8 (0.1–21.0) months at 1L and 2L, respectively. The median time on treatment was 5.5 (<0.1–24.3) and 2.5 (<0.1–18.1) months (Supplementary file Figure S2) for first- and second-line treatment, respectively.
DISCUSSION
Our study provided insight into many aspects of the management of patients with mNSCLC initiating treatment for their disease after the reimbursement of pembrolizumab in Greece.
A key study finding was that the PD-L1 test rate increased rapidly over the study period, from 4.8% in Q3 of 2016 to 64.0% in Q3 of 2019; in fact, the average rate over Q1–Q3 of 2019 was 73.8%. This study finding was anticipated, as PD-L1 expression plays a significant role in the treatment choice in the IO era. To our knowledge, the PD-L1 test rates have not been assessed in other European countries. Similar, however, increases in PD-L1 test rates have been reported in Israel18 and the US19. Furthermore, our study showed that the proportion of patients with PD-L1 TPS ≥50% at 1L (23.4%) was similar with previous studies reporting proportions up to 30%20. In contrast to the increase in PD-L1 test rates, the EGFR and ALK test rates remained stable during observation, being informative for about 40.0% of patients. Thus, EGFR, ALK, and PD-L1 testing could be further increased in Greece, as biomarker testing combined with appropriate 1L treatment results in longer OS compared with untested patients21.
Our study showed that factors associated with PD-L1 testing were age, ECOG PS, tumor histology, and disease stage. These findings are overall consistent with a recent US retrospective study reporting that patients were less likely to be tested for PD-L1 before 1L treatment if they were older (compared with age <45 years), had squamous versus non-squamous cell carcinoma, or had recurrent disease versus de novo mNSCLC diagnosis19.
Regarding the 1L treatment patterns for patients with negative or unknown EGFR/ALK status, 59.3% of patients with PD-L1 TPS ≥50% received PD-1/PD-L1 therapy. In contrast, Moser et al.18 reported that 94.5% of patients with a similar molecular profile received PD-1/PD-L1 therapy, indicating that the use of PD-1/PD-L1 inhibitors in these patients could be further increased in Greece. A small number of PD-L1-tested patients who had previously been treated with chemotherapy (either for an earlier stage of NSCLC [n=24] or as adjuvant treatment for the stage with which the patient was enrolled in the study [n=1]) and experienced disease progression in metastatic stage, received single-agent nivolumab (1L in the context of the study). This treatment approach is supported by the CheckMate 057 and 017 studies which showed that single-agent nivolumab was associated with a significant survival benefit over docetaxel in patients with mNSCLC who had disease recurrence or progression (within 6 months (following adjuvant or neoadjuvant platinum doublet chemotherapy)22,23. In the 2L, almost all (92.3%) patients with PD-L1 TPS <1% received nivolumab, while more than half (55.9%) of patients with PD-L1 TPS ≥1% received pembrolizumab.
One emerging challenge with the use of PD-1/PD-L1 inhibitor therapy is hyperprogressive disease (HPD), manifesting as an increase in tumor burden of >50% (an increase in growth and/or increase in metastases) compared with scans done before the initiation of immunotherapy24,25; in NSCLC, the reported proportions of patients experiencing HPD with PD-1/PD-L1 inhibitor therapy range from 8–21%. Patients with HPD have a significant decrease in OS compared with patients without HDP. Of note, HPD occurrence is lower in patients treated with combined chemotherapy and PD-1/PD-L1 inhibitor therapy compared to patients treated with PD-1/PD-L1 inhibitor monotherapy24. Thus, although PD-L1 testing can identify patients suitable for PD-1/PD-L1 inhibitor therapy (i.e. PD-L1 ≥50%), clinicians should take into account other factors, including ECOG PS ≥2, in determining the appropriate treatment24.
Our time-to-event analyses showed that the median OS and PFS at 1L for patients testing EGFR/ALK negative or unknown were 8.8 and 3.4 months, respectively, and the response rate was 23.4%. Similar OS (8.9 months) and PFS (4.7 months) findings have been reported after the launch of 1L IO therapies in a recent observational study conducted in Italy26. In contrast, OS rates of 13.7 months were reported19 for patients with mNSCLC in the US in 2018–2021, although the authors did not analyze patients by EGFR/ALK status.
Regarding survival by treatment class, the highest median OS was achieved with PD-1/PD-L1 inhibitors (26.7 months) compared with chemotherapy (10.3 months) or other treatment classes. This finding suggests that patients treated with platinum-based chemotherapy could benefit from PD-1/PD-L1 therapy at 1L. Data from retrospective US6 and UK27 studies have reported median OS of about 20.0 and 14.0 months with IO monotherapies, respectively, although the UK study did not stratify patients by EGFR and ALK status.
Limitations
We acknowledge certain limitations of this study. The study population and practice patterns captured in the Sotiria LCR may not be representative of those in other countries or other sites in Greece, although the Sotiria hospital is a reference center for lung diseases in Greece. Thus, the generalizability of the results may be limited. There were a small number of patients in certain stratification groups, particularly at 2L treatment and beyond, which may result in wide CIs and limit the strength of any conclusions. Lastly, the results need to be interpreted with caution due to the lack of randomization across treatment groups.
CONCLUSIONS
Over the 4-year observational period of this study, PD-L1 testing increased rapidly to about 75.0% of patients with mNSCLC; in contrast, the testing rates for EGFR/ALK remained stable and were conducted for about 40.0% of all patients. PD-1/PD-L1 inhibitors were most frequently offered to patients with PD-L1 TPS ≥50% in the 1L, and the most frequent 2L treatment regardless of PD-L1 expression levels. Pembrolizumab was the most frequent PD-1/PD-L1 inhibitor, given to patients regardless of PD-L1 expression levels at 1L and to patients with PD-L1 TPS ≥50% at 2L. The patients’ median OS at the 1L was longer with PD-1/PD-L1 inhibitors than with the other available therapies.

